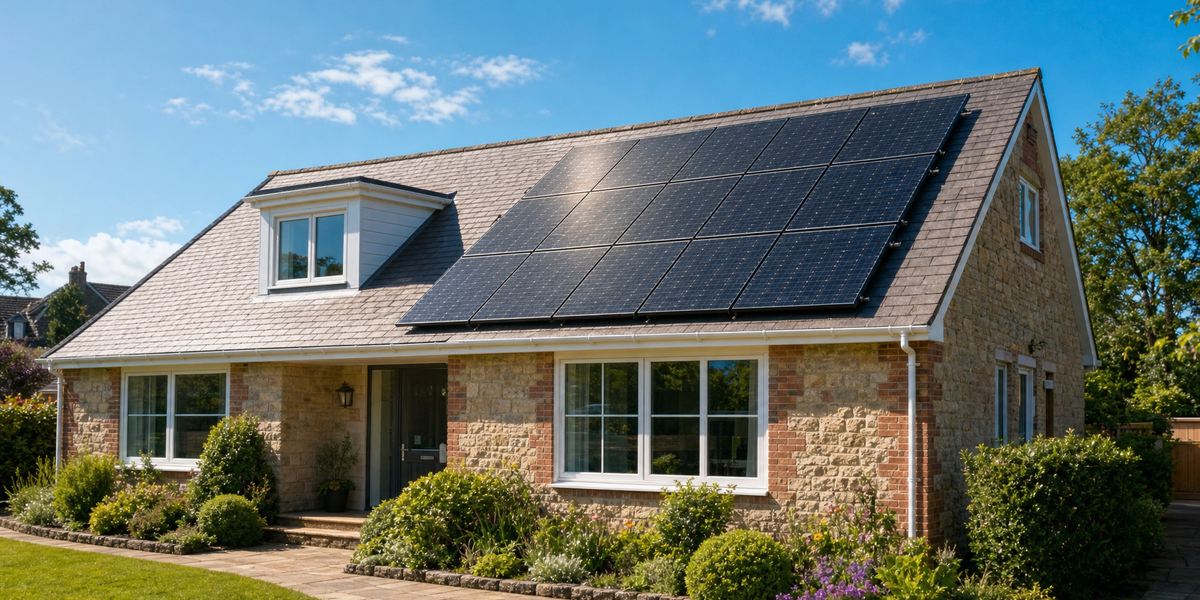
Solar Panel Statistics for the South Coast: How Dorset and Hampshire Compare
When people talk about solar panel statistics UK-wide, the South Coast tends to get overlooked in favour of headline figures from Scotland or the Midlands. That is a shame, because Dorset and Hampshire are two of the most solar-productive regions in England, and the numbers tell a genuinely interesting story. Whether you already have panels on your roof or you are weighing up whether to install, understanding how your region performs compared to the national picture helps you make smarter decisions about your investment.
Why the South Coast Is a Solar Hotspot
The South Coast of England receives more sunshine hours than almost anywhere else in the UK. According to the Met Office, coastal areas in Dorset and Hampshire regularly record over 1,800 sunshine hours per year, compared to a UK average closer to 1,400. That gap is not trivial. More sunshine hours translate directly into more kilowatt-hours generated from the same physical system, which is why a 4kWp array in Bournemouth will consistently outperform an identical system installed in Manchester or Edinburgh.
This solar advantage is one reason the South Coast saw early and strong uptake of rooftop solar, particularly during the Feed-in Tariff era from 2010 onwards. Many of those systems are now well into their second decade, which brings its own set of maintenance considerations. If you have a legacy FiT system and want to understand how to protect those payments, our article on Feed-in Tariff systems in 2026 goes into detail on what you need to know.
Solar Adoption Rates: Where Dorset and Hampshire Stand
Nationally, the UK passed four million solar installations in 2023 and has been adding capacity at pace ever since. Solar Energy UK, the industry trade body, reports that residential solar continues to be the fastest-growing segment, driven by rising energy prices and improved battery storage options.
Within that national picture, Hampshire is one of the highest-density counties for domestic solar in England. The combination of large suburban housing stock, high home ownership rates, and a population that has historically been engaged with energy costs creates strong conditions for adoption. Dorset follows closely, with rural properties in particular tending to have larger roof areas and stronger motivation to reduce grid dependency.
The EPC register gives a useful indirect measure of solar prevalence, since EPCs now flag the presence of solar panels as part of the property assessment. In both Dorset and Hampshire, the proportion of EPCs mentioning solar is well above the national average, which broadly aligns with what installers on the South Coast have been reporting for years.
For Bournemouth specifically, the case for solar is particularly strong. We have covered this in depth in our piece on why Bournemouth is one of the best places in the UK for solar, which pulls together sunshine data, grid costs, and export rates to show the full financial picture.
Solar Panel Statistics UK: How South Coast Output Compares
One of the most practically useful solar panel statistics UK homeowners can look at is specific yield, which is the amount of electricity generated per kilowatt of installed capacity. In the South East and along the South Coast, specific yield for a south-facing, unshaded system typically sits between 950 and 1,050 kWh per kWp per year. The UK national average is closer to 850 to 900 kWh per kWp.
That means a typical 4kWp system in Hampshire or Dorset should generate somewhere between 3,800 and 4,200 kWh in a good year. At current electricity prices, that represents significant saving potential. When you factor in Smart Export Guarantee payments on top of that, the financial case is even stronger. If you want to check whether you are getting a competitive SEG rate, our guide to Smart Export Guarantee payments in 2026 runs through the main tariffs and how to switch.
It is worth remembering, though, that those output figures are for a well-maintained system in good condition. Real-world performance can fall short of those numbers for a range of reasons, from soiling and shading to inverter degradation. The Energy Saving Trust has published guidance showing that poorly maintained systems can lose 15 to 25 percent of their expected output over time, which is a significant chunk of the financial return.
How Salt Air and Coastal Conditions Affect Performance
Here is a factor that rarely gets discussed in national solar statistics but matters a great deal on the South Coast: salt air. Properties within a few kilometres of the sea, which covers a large proportion of homes in Bournemouth, Poole, Christchurch, and along the Hampshire coastline, are exposed to airborne salt particles that gradually deposit on panel surfaces.
Salt deposits do not just cause surface soiling in the way that general dust or pollen does. They can also accelerate corrosion of panel frames, junction boxes, and mounting hardware over time. The cumulative effect on output can be measurable, and it makes regular professional cleaning and inspection more important for coastal homes than for inland properties.
We have written specifically about this in our article on how salt air damages solar panels on the South Coast, which explains the mechanisms involved and what you can do to manage the risk. For homeowners in Southampton, there is an additional factor: port-related dust from the docks, which creates its own soiling challenge. Our dedicated piece on solar panel maintenance in Southampton addresses this directly.
All of this means that the headline output statistics you see quoted for South Coast solar systems need to be understood in context. A system that started life generating 4,000 kWh per year may be producing significantly less a decade later if it has not been serviced regularly. Panel degradation is a well-documented phenomenon, and our article on solar panel degradation rates breaks down what you can realistically expect year on year.
The Role of System Age in South Coast Solar Data
Because Dorset and Hampshire were early adopters of domestic solar, the regional fleet of installed systems skews older than the national average. A significant proportion of South Coast systems were installed between 2010 and 2014, meaning they are now between twelve and sixteen years old.
This matters for two reasons. First, older systems need more attention. Inverters typically have a lifespan of ten to fifteen years, meaning many systems in the region are either approaching or past the point where an inverter replacement becomes worth considering. Our analysis of whether to replace your old solar inverter is a good starting point if you are in that situation.
Second, older systems represent a large untapped opportunity for performance improvement. A system that has never had a professional inspection or cleaning could be operating well below its potential. That is precisely the problem that No1 Solar Care's Solar MOT is designed to address. The inspection covers panels, inverter, cabling, mounting, and generation data, giving you a clear picture of where your system stands and what, if anything, needs attention.
If you are unsure where to start, the quickest first step is our free 60-second solar health check, which helps you identify whether your system is likely to be underperforming before you commit to anything further.
What the Statistics Mean for Homeowners Making Decisions Today
The picture that emerges from South Coast solar data is broadly positive but nuanced. The region has excellent solar resource, strong financial incentives through the Smart Export Guarantee, and a large installed base of systems that, in many cases, are working well. At the same time, the age profile of many local systems means that performance monitoring and maintenance are increasingly important.
Ofgem's Smart Export Guarantee ensures that any household with a system under 5MW can receive payment for electricity exported to the grid, but the rate varies significantly between suppliers. Many South Coast homeowners on older FiT contracts may also be coming to the end of their guaranteed payment period and facing decisions about what to do next.
For anyone thinking about adding battery storage to an existing system, the economics have shifted considerably in recent years. Our guide to solar battery storage in 2026 looks at whether it makes financial sense for South Coast homeowners specifically, taking into account regional output data and current electricity prices.
There is also the question of property value. Research consistently shows that solar panels add value to homes in England, and the South Coast property market is no exception. Our article on whether solar panels add value to your home in 2026 looks at the UK evidence in detail.
For those considering a new installation or a significant upgrade, the VAT situation is also worth understanding. The government's VAT guidance on energy saving materials explains the current zero-rating, which is scheduled to change in 2027. Our piece on the 0% VAT on solar panels ending in March 2027 explains what this actually means in practical terms.
Keeping Your System in the Top Percentile
Statistics are only useful if you act on them. The data clearly shows that South Coast solar systems have the potential to outperform the national average, but that potential is only realised when systems are properly maintained. Soiling, inverter faults, shading from tree growth, and degraded cabling are all common issues that erode real-world output without necessarily triggering any obvious error messages.
No1 Solar Care's Solar MOT service is specifically designed for homeowners who want to know exactly what condition their system is in. Based in Bournemouth and covering the South Coast, we carry out hands-on inspections rather than desktop assessments, which means we can identify issues that remote monitoring systems routinely miss. The cost of a missed fault, in lost generation and potential repair bills, almost always outweighs the cost of a professional inspection.
For a broader look at what proper maintenance involves and what it typically costs, our guide to solar panel maintenance costs in the UK for 2026 is a practical starting point. And if you want to understand the full financial case for regular servicing, our data analysis on the true cost of neglecting your solar panels makes the numbers very clear.
Frequently Asked Questions
What are the key solar panel statistics UK homeowners on the South Coast should know?
South Coast homes benefit from over 1,800 sunshine hours annually, compared to the UK average of around 1,400. A typical 4kWp system in Dorset or Hampshire should generate between 3,800 and 4,200 kWh per year in good condition, which is noticeably above what the same system would produce in most other parts of England.
Do solar panels in Hampshire outperform those in Dorset?
The difference between the two counties is relatively small in terms of solar irradiance. Hampshire's slightly more eastern position can give marginal advantages in certain weather patterns, but for practical purposes both counties sit within the same high-performance band. Local factors like shading, roof orientation, and system condition matter far more than county boundaries.
How does salt air in coastal areas affect solar panel output?
Salt deposits from the sea settle on panel surfaces and reduce light transmission over time. Unlike ordinary dust, salt is hygroscopic and can also accelerate corrosion of metallic components. Homes within a few kilometres of the coast, particularly in Bournemouth and Poole, benefit from more frequent professional cleaning than inland properties to maintain peak output.
How often should a South Coast solar system be professionally inspected?
Most experts recommend a professional inspection every one to two years for coastal properties, and at least every two years for inland systems. Older systems, particularly those installed during the Feed-in Tariff era, should be inspected more regularly given the age of their components. A Solar MOT gives you a comprehensive assessment in one visit.
What grants are available for solar panels in Dorset and Hampshire in 2026?
The main routes to funding include the ECO4 scheme for eligible lower-income households, administered through Ofgem, and the Warm Homes Plan which is being rolled out through local authorities. Dorset and Hampshire both have councils actively engaged in these programmes. Our article on the Warm Homes Plan for Dorset and Hampshire homeowners covers eligibility and how to apply.
How can I tell if my South Coast solar system is underperforming?
The simplest way is to compare your actual generation figures against what your system should be producing based on its rated capacity and your location. If you do not have a monitoring app or your figures seem low, the free 60-second solar health check on the No1 Solar Care website gives you an immediate indication of whether your system is likely to be underperforming and what might be causing it.
Are South Coast properties with solar panels worth more?
Generally yes. Research from Rightmove and independent analysts has consistently found that solar panels add measurable value to properties in England, with the effect strongest in areas with high electricity costs and good solar resource. Both Dorset and Hampshire qualify on both counts, making rooftop solar a genuine asset for homeowners planning to sell in the coming years.
Book your Solar MOT today. Call 01202 023069 or visit no1solarcare.co.uk/solar-mot