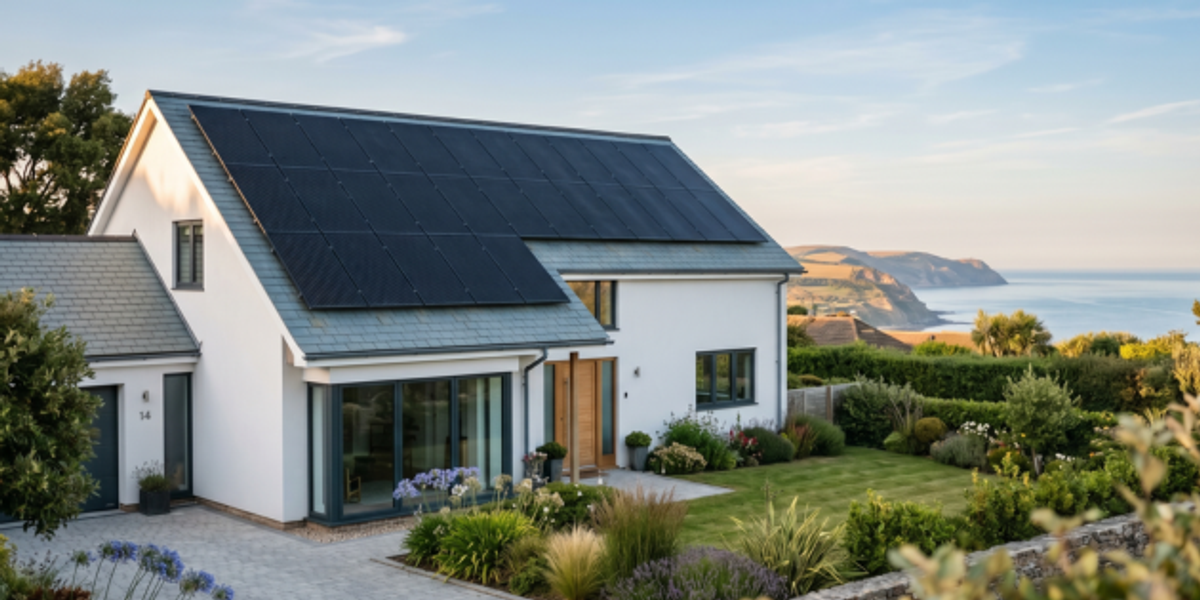
Energy Price Cap 2026: Why Solar Panel Owners on the South Coast Are Better Protected
Energy Price Cap 2026: Why Solar Panel Owners on the South Coast Are Better Protected
The energy price cap for 2026 is already causing concern among households across Britain, and homeowners are right to pay attention. For those with solar panels installed, however, the picture looks considerably brighter. The energy price cap 2026 solar panels discussion centres on one simple truth: every kilowatt hour you generate yourself is one you don't have to buy at increasingly expensive rates from the grid.
Ofgem reviews the price cap quarterly, and projections for 2026 suggest continued volatility. While nobody can predict exact figures eighteen months ahead, the pattern since 2022 has been clear. Energy costs have risen dramatically, and even when caps fall slightly, they remain far above pre-crisis levels. The average household energy bill sat around £1,200 annually before 2021. Today, we're looking at figures nearly double that, and 2026 projections from industry analysts suggest bills could hover between £1,800 and £2,100 depending on wholesale market conditions.
For South Coast residents with solar installations, this creates an interesting dynamic. Your panels continue producing free electricity regardless of what Ofgem decides. The sun doesn't check wholesale gas prices before shining on your roof in Bournemouth or Portsmouth.
How the Price Cap Actually Works
There's considerable confusion about what the energy price cap actually does. It doesn't cap your total bill. Instead, it limits how much suppliers can charge per unit of electricity and gas, plus a daily standing charge. If you use more energy, you'll pay more than the cap figure suggests.
This matters for solar panel owners because the cap only applies to energy you import from the grid. Every unit your panels produce and you consume directly never touches the cap calculation. It's completely free energy that exists outside the entire pricing structure.
The cap currently changes four times per year, in January, April, July and October. Each change brings uncertainty for household budgets. Solar panels offer stability against this constant fluctuation. Your generation costs were fixed the day you installed the system. Whether the cap rises by £200 or drops by £100, your solar electricity costs nothing.
Standing Charges and the Hidden Cost
One aspect often overlooked is the standing charge. Even with solar panels generating all the electricity you need during summer days, you'll still pay a daily standing charge to remain connected to the grid. These charges have risen substantially, from around 25p daily in 2021 to roughly 60p today for electricity alone.
Solar panels don't eliminate standing charges, but they do dramatically reduce your overall exposure to price cap changes. If 40% of your annual electricity comes from your panels, that's 40% of your consumption completely immune to whatever the 2026 cap brings.
Solar Generation on the South Coast: Real Numbers
The South Coast enjoys some of the best solar irradiance in the UK. Bournemouth averages around 1,750 hours of sunshine annually, compared to roughly 1,400 hours in Manchester or Leeds. This translates directly into higher generation figures for panel owners in Dorset and Hampshire.
A typical 4kWp residential system on the South Coast generates between 3,800 and 4,200 kWh annually when properly maintained. At current electricity rates of approximately 24.5p per kWh under the price cap, that represents £930 to £1,030 worth of electricity per year. If 2026 brings rates of 28p per kWh, which some analysts predict, that same generation becomes worth over £1,100 annually.
These figures assume your system is performing optimally. Degraded panels, dirty surfaces, or faulty inverters can reduce generation by 15% to 25%. That's potentially £250 or more in lost value each year, which brings us to why maintenance has become genuinely important for South Coast solar owners.
The Maintenance Factor Most Owners Ignore
Solar panels are remarkably reliable, but they're not maintenance-free. After five years of operation, most systems begin showing some efficiency loss beyond the normal 0.5% annual degradation manufacturers account for. Accumulated grime, salt deposits from coastal air, bird droppings, and developing microcracks all contribute to underperformance.
Many homeowners in Bournemouth and along the Hampshire coast assume their panels are fine because they're still producing something. The problem is that a 20% efficiency loss isn't obvious when you're glancing at your inverter display occasionally. You might be generating 3,200 kWh instead of 4,000 kWh and have no idea.
If you're not sure how your system is performing, our free 60-second solar health check gives you a quick benchmark before committing to anything. For a deeper assessment, the No1 Solar Care Solar MOT covers panel condition, inverter performance, electrical connections, mounting integrity, and overall system efficiency. For South Coast owners facing the 2026 price cap, knowing your system actually delivers its rated output becomes financially significant.
Calculating Your Protection Level Against 2026 Price Rises
Let's work through the numbers for a typical South Coast household. The average home uses around 2,900 kWh of electricity annually. A well-maintained 4kWp solar system generates roughly 4,000 kWh in this region. On paper, you're producing more than you need.
Reality is more complex. Without battery storage, you'll export much of that generation when you're at work or asleep, then import from the grid during peak evening hours. Most households with solar panels self-consume between 25% and 45% of their generation, depending on occupancy patterns and appliance usage.
Taking 35% self-consumption as a reasonable middle estimate, that 4,000 kWh system provides 1,400 kWh of free electricity annually. At projected 2026 rates, you're avoiding perhaps £390 to £420 in grid electricity costs. Add any Smart Export Guarantee payments for the electricity you send back, typically 4p to 15p per kWh depending on your tariff, and the total value increases.
This protection scales with system size. Homeowners in Dorset with larger 6kWp systems generating 6,000 kWh might see protection worth £600 or more against the 2026 cap, assuming similar self-consumption rates.
Battery Storage Changes the Equation
Battery storage dramatically increases self-consumption rates. With a properly sized battery system, homeowners can achieve 70% to 85% self-consumption. That transforms the protection calculation significantly.
Using the same 4kWp system generating 4,000 kWh, 80% self-consumption means 3,200 kWh of free electricity. At 28p per kWh, that's £896 annually that completely bypasses whatever the 2026 price cap dictates. Add the export payments for the remaining 800 kWh, and your total protection approaches £1,000 yearly.
Battery costs have fallen substantially. A 5kWh system now costs between £2,500 and £4,000 depending on brand and installation complexity. For households planning to stay in their property for ten years or more, the maths increasingly favours adding storage, particularly given the trajectory of energy prices.
What Industry Analysts Expect for 2026
Predicting energy prices two years ahead involves substantial uncertainty, but analysts use wholesale futures markets and structural factors to build projections. Energy consultancies regularly publish forecasts that energy companies and regulators take seriously.
Current projections suggest the price cap in 2026 will remain elevated compared to pre-crisis norms. Wholesale gas prices, which heavily influence electricity costs even for renewable generation, are expected to stay above 2019 levels for the foreseeable future. Infrastructure investments needed for the net zero transition will add costs. Standing charges may rise further as fixed network costs spread across potentially fewer customers as some go off-grid partially or fully.
The Energy Security Strategy aims to reduce dependence on international gas markets, but building new nuclear, offshore wind, and grid infrastructure takes years. The benefits won't fully materialise until the late 2020s at earliest. Until then, households remain exposed to volatile wholesale markets and the price cap mechanism that follows them.
Regional Considerations for Hampshire and Dorset
Energy costs don't vary by region under the price cap, but solar generation potential certainly does. South Coast homeowners have a genuine advantage over those in northern England or Scotland. Better irradiance means more generation, which means greater protection against whatever 2026 brings.
This regional advantage only works if your system actually captures it. Panels facing south at optimal angles around 35 degrees generate most. East or west-facing installations produce roughly 15% less. North-facing panels, which unfortunately exist on some properties where installers prioritised aesthetics over performance, generate 40% or more below potential.
Shading issues also affect South Coast properties. Trees that were small when panels were installed a decade ago may now cast afternoon shadows. New developments nearby might have changed the skyline. These gradual changes erode your protection against price rises without obvious symptoms.
Maximising Your Protection Before 2026
With roughly eighteen months until 2026, homeowners have time to optimise their systems. Several steps make genuine differences to how much protection your solar panels provide against coming price cap changes.
First, understand what your system actually produces. Most inverters log generation data. Compare your annual totals against what the installer predicted. If you're significantly below those estimates, investigation is warranted. The Solar MOT service includes performance analysis that benchmarks your system against expected output for your specific configuration and location.
Second, consider your consumption patterns. Running dishwashers, washing machines, and other heavy loads during peak generation hours increases self-consumption. Simple timer adjustments cost nothing but boost how much free solar electricity you actually use.
Third, examine your export tariff. The Smart Export Guarantee offers various rates from different suppliers. If you're still on an old feed-in tariff, you're likely receiving excellent export rates, but if you installed after 2019, shopping around for better SEG rates can add meaningful annual income.
When Maintenance Becomes Essential
Certain signs indicate your system needs professional attention sooner rather than later. Generation dropping more than 10% year-on-year without obvious causes like unusual weather warrants investigation. Error messages on your inverter display, even intermittent ones, suggest developing faults. Physical damage visible from ground level, including cracked glass, lifting edges, or discoloured cells, needs assessment.
Systems over eight years old should have professional inspection regardless of apparent performance. Inverters typically last 10 to 15 years, and catching early failure signs saves the inconvenience and lost generation of unexpected breakdown. DC isolators, the switches that allow safe system shutdown, degrade over time and present fire risks if faulty.
The South Coast's maritime climate adds specific challenges. Salt-laden air accelerates corrosion of mounting hardware and electrical connections. Seagulls cause more soiling issues than inland birds. Coastal wind stresses mounting systems more than sheltered locations experience.
The Longer View: Solar Value Beyond 2026
Focusing solely on the 2026 price cap understates the protection solar panels provide. Most systems operate productively for 25 to 30 years. Over that timespan, you'll experience numerous price cap changes, energy crises, and market fluctuations. Throughout all of it, your panels continue generating free electricity.
Projecting energy prices twenty years ahead is impossible, but the direction seems clear. Decarbonisation costs money. Replacing aging infrastructure costs money. Insulating the UK from future geopolitical energy shocks requires investment that ultimately appears on bills. The households best protected are those generating their own electricity.
Property valuations increasingly reflect this. Industry research suggests solar panels add a meaningful percentage to property values, with higher premiums in areas with expensive electricity. As price caps rise, so does the value of the protection panels provide.
Taking Action Now
Waiting to see what happens with the 2026 price cap before acting means losing potential savings today. Every month your system underperforms is money lost that doesn't come back. If maintenance could recover 20% lost efficiency on a system generating £1,000 worth of electricity annually, that's £200 per year.
For homeowners without solar panels, the decision calculus has shifted. Payback periods have shortened dramatically as electricity prices rose. A system that took twelve years to pay for itself in 2019 might now pay back in six or seven years. Waiting for prices to fall is essentially betting against the clear trend.
For those already with panels, ensuring optimal performance is the priority. The protection only works if the system actually delivers. Coastal properties in Bournemouth, Poole, Southampton and across Hampshire face specific maintenance challenges that justify regular professional inspection.
Frequently Asked Questions
How much will the energy price cap be in 2026?
Exact figures remain uncertain, but analyst projections suggest the energy price cap 2026 solar panels owners will face could see typical bills between £1,800 and £2,100 annually. Wholesale market conditions, geopolitical factors, and government policy decisions between now and then will influence the final numbers significantly.
Do solar panels completely protect me from energy price rises?
Solar panels protect you from price rises on the electricity you generate and consume yourself. You'll still pay grid rates for electricity imported during evenings and cloudy periods, plus standing charges. Most households reduce their grid dependence by 25% to 45% with panels alone, or 70% to 85% with battery storage added.
How often should solar panels be serviced on the South Coast?
Annual visual inspection is sensible, with professional servicing every three to five years for systems under ten years old. Older systems or those in exposed coastal locations around Bournemouth and Hampshire benefit from more frequent professional attention due to salt air corrosion and weather exposure affecting mounting hardware and connections.
What does a Solar MOT include and is it worth the cost?
The No1 Solar Care Solar MOT includes comprehensive panel inspection, inverter diagnostics, electrical connection testing, mounting system assessment, and performance benchmarking. For systems generating £800 to £1,200 worth of electricity annually, identifying and fixing efficiency losses typically delivers payback within twelve months.
Will energy prices ever return to pre-2022 levels?
Most analysts consider a return to 2019 price levels unlikely within this decade. Structural costs including infrastructure investment, decarbonisation requirements, and reduced reliance on cheap Russian gas have permanently altered the market. Energy price cap 2026 solar panels discussions reflect this new reality where self-generation provides genuine financial protection.
Can I add battery storage to my existing solar panel system?
Yes, battery storage can be retrofitted to most existing solar installations. Costs range from £2,500 to £6,000 depending on capacity and brand. For South Coast homeowners planning to remain in their property long-term, adding storage significantly increases self-consumption and protection against future price cap rises.
How do I know if my solar panels are underperforming?
Compare your annual generation against installer predictions and previous years. Drops exceeding 5% beyond normal degradation warrant investigation. Our free 60-second solar health check gives you a quick performance benchmark, or our team at No1 Solar Care can carry out a full Solar MOT inspection on your Dorset or Hampshire system to identify specific issues reducing performance.
Book your Solar MOT today. Call 01202 023069 or visit no1solarcare.co.uk/solar-mot